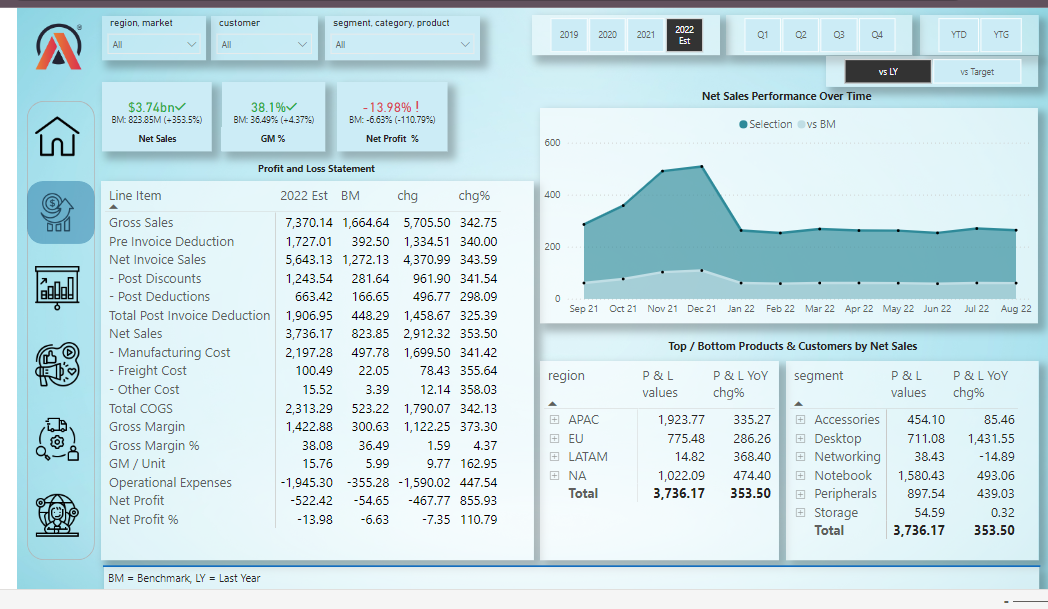
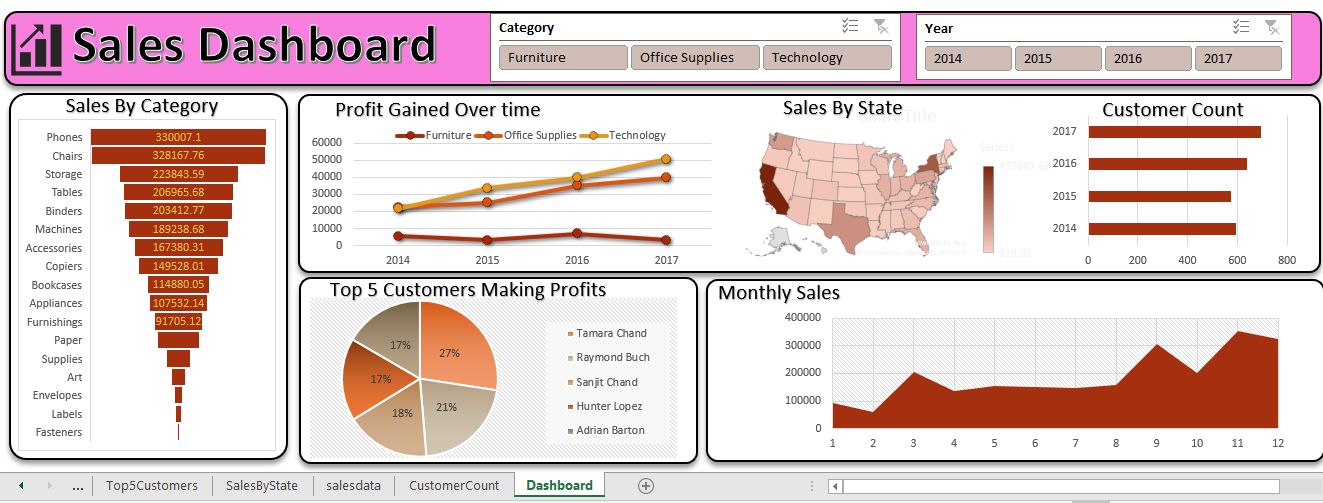
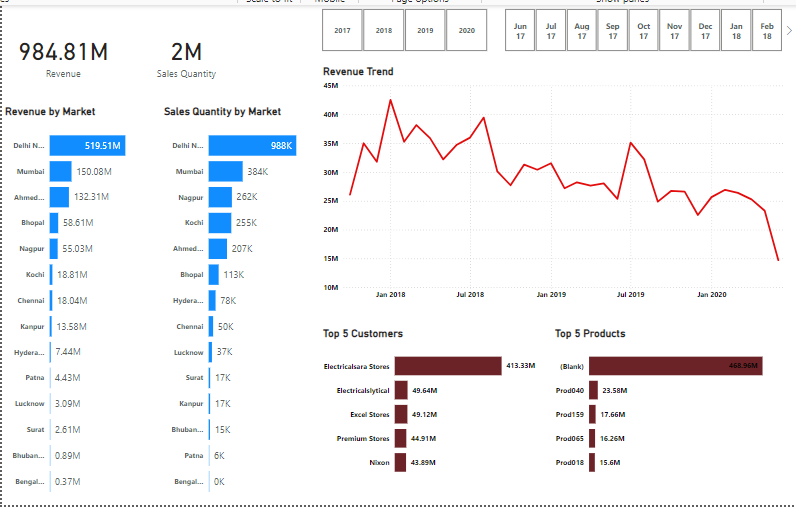
Projects

Welcome to the project page of my portfolio website, showcasing my expertise in data analysis and data science. Below, you'll find a curated selection of projects that highlight my proficiency in extracting valuable insights from data and developing innovative solutions to real-world problems. @Rahul_Patel

Google Data Analytics Capstone Project -
[Cyclistic Case Study]

This project serves as the capstone for the Google Data Analytics Professional Certificate course on Coursera. It presents a case study centered around data from Cyclist, a fictional bike rental company in Chicago. The objective is to discern and comprehend the primary distinctions between annual members and casual riders, leveraging data analysis techniques.

Excel-Sales-Analytics

In this Project I developed customer performance reports and compared market performance with sales targets to identify sales patterns and track KPIs. Additionaly, Created P&L reports by fiscal year, month, and market to evaluate financial performance and support decision-making.

Sales Dashboard Using
Excel

This project features a Sales Dashboard created in Microsoft Excel. The dashboard offers an interactive and visual analysis of sales data, helping users understand sales performance, identify trends, and derive key insights.

Data Cleaning in
SQL

In this project, I've executed data cleaning procedures within SQL Server, focusing on the Nashville housing dataset. Through a series of SQL queries and transformations, I've addressed inconsistencies, missing values, and anomalies in the data to ensure its quality and reliability for subsequent analysis

Sales Dashboard Using
Power BI

This project entails the development of a comprehensive Power BI Dashboard specifically tailored for a computer hardware business grappling with the challenges posed by a dynamically evolving market. The dashboard will provide a robust analytical toolset to enable the business to monitor key performance indicators, track market trends, and make data-driven decisions.

Tableau Projects

In this section, I've created visualization dashboards using Tableau for projects encompassing Covid-19 data analysis, CO2 emissions per capita, Bitcoin prices, and visual representation of World Happiness data. These dashboards offer intuitive insights into the respective datasets, enabling users to explore trends, correlations, and patterns effectively.

Data Exploration in
SQL

In this project, I conducted data exploration of the Covid-19 dataset using SQL Server. Through SQL queries and analysis, I delved into the dataset's various dimensions, such as infection rates, geographical trends, demographic patterns, and temporal variations, to gain insights into the spread and impact of the pandemic.

Movie
Correaltion with
Python

In this project, I investigated the factors influencing gross revenue in the film industry. By analyzing various variables such as production budget, genre, release date, cast, and marketing expenditure, I aimed to discern their impact on the overall revenue generated by movies.

Data Exploration and Cleaning-Titanic Dataset

In this project, I've engaged in exploratory data analysis (EDA) by harnessing a variety of Python libraries. Through the utilization of tools such as Pandas, NumPy, Matplotlib, Seaborn, and others, I've conducted comprehensive data exploration, visualization, and statistical analysis to gain insights into the underlying patterns, trends, and relationships within the dataset.

Movie
SQL Queries, Analysis and Visualization using Jupyter Notebook

In this project, I've conducted a series of SQL queries on the Sakila sample database within a Jupyter notebook environment. The SQL implementation employed for this notebook is SQLite3. Through the execution of these queries, I've explored the dataset, extracted relevant information, and performed analytical tasks to gain insights into the data stored within the Sakila database.

EPL 2020-21
Dataset Analysis

In this project, I've undertaken an Exploratory Data Analysis (EDA) utilizing Python on the English Premier League (EPL) 2020-21 Football Dataset. Through systematic examination and visualization of the data, I've aimed to uncover patterns, trends, and insights that offer valuable perspectives on the performance and dynamics within the league


Pyhton_Project
Netflix Dataset Analysis

In this project, I've conducted an in-depth big data analysis on diverse parameters within the Netflix dataset. Leveraging advanced analytical techniques, I've explored various dimensions of the dataset to extract valuable insights and discern trends, contributing to a comprehensive understanding of its contents.


India Census-2011 Dataset Analysis

In this project, I've conducted comprehensive big data analysis on various parameters extracted from the India Census-2011 dataset. Through extensive examination and exploration, I've delved into diverse facets of the dataset to derive insights and draw meaningful conclusions.

  • View Project

  • Pyhton_Project
    London Housing Dataset Analysis

    In this project, the London Housing Dataset is analyzed using Python. The analysis includes exploring housing trends, identifying key factors affecting prices, and visualizing data to uncover insights about the real estate market in London.